Dyadic Data Analysis
Actor-Partner Interdependence and Multilevel Approaches
Acknowledgment
Kenny, D. A., Kashy, D. A., & Cook, W. L. (2006). Dyadic data analysis. Guilford Press.
Visit: “David Kenny web page”
Map
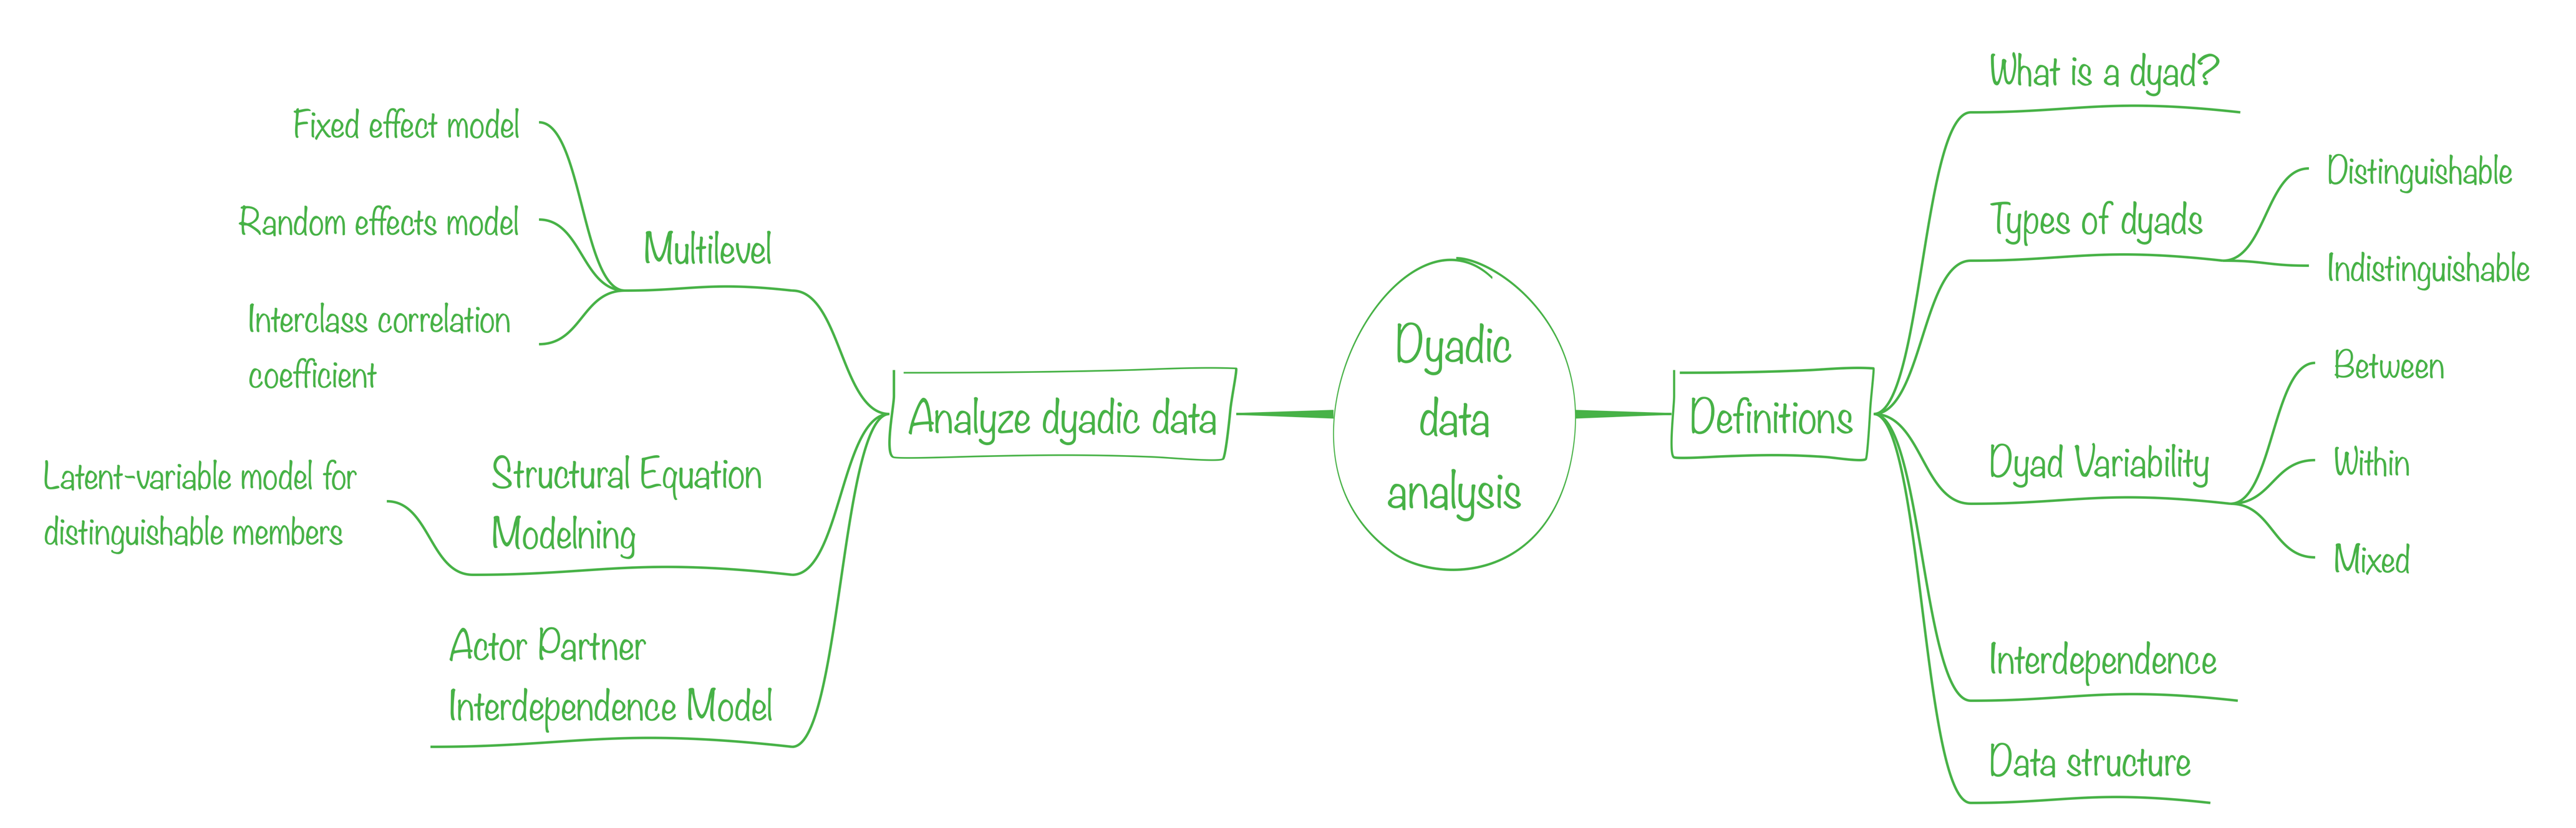
Definitions
The dyad is the unit of interpersonal interaction
- Partners
- Friends
- Family
- Co-workers
Types of dyads
Distinguishable
There is a variable that can be used to differentiate between the two members of the dyad.
Husband and wife
First and second author
The advisor and PhD. Student
Indistinguishable
There is not a variable that can be used to differentiate between the two persons.
Twins
Best friends (mutually chosen)
Roommates
Activity: Classify the Dyad
In pairs, classify each example as Distinguishable (🧟️🧛️ = D) or Indistinguishable (🧟️🧟️ + I)
A therapist and their patient Two siblings Two co-authors who contributed equally A parent and an adolescent child Two romantic partners in a same-sex relationship
Dyad Variability
Between
- Time together
- Family income
Within
- Time using the car (only one car)
- Gender (heterosexual couple)
Mixed
- Risk factor
- Age
Interdependence
Non independence
If the two scores from the two members of the dyad are non-independent, then those two scores are more similar to (or different from) from one another than are two scores from two people who are not members of the same dyad.
More similar within the dyad than the average
🧟🧟️
🧟️🧛️
🧛️🧛️
Activity: Spotting Non-Independence
Activity: Spotting Non-Independence
Is there non-independence? If so, would scores be more similar or more different within dyads?
Married couples rating their satisfaction with the relationship.
Roommates reporting hours of sleep per night.
Siblings reporting their parents’ parenting style.
Warning
Non-independence is not always positive! In competitive dyads (e.g., debate opponents), members’ scores may be negatively correlated. The statistical problem of non-independence applies regardless of the direction.
Data structure
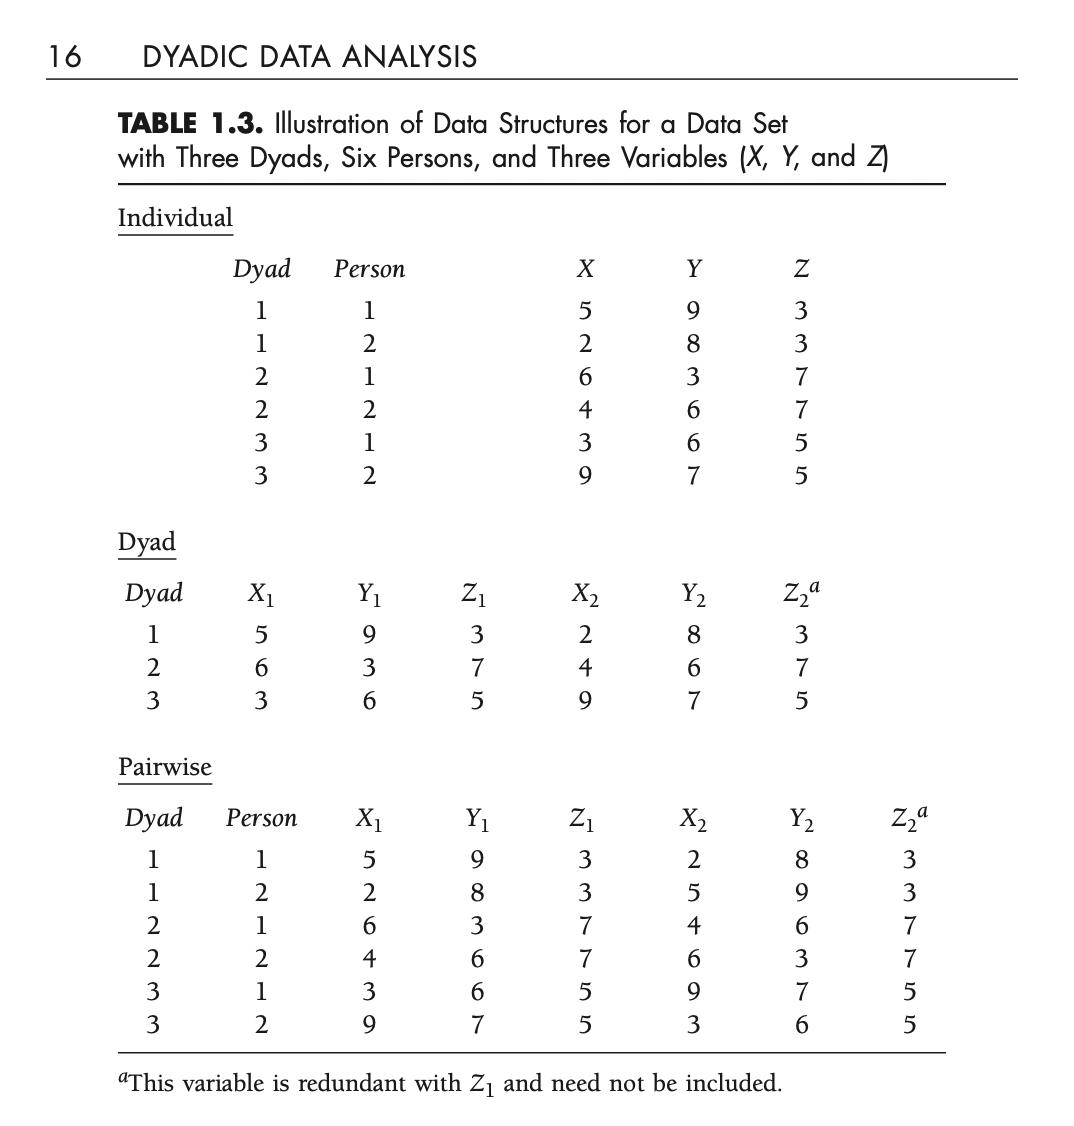
Exercise: Long to Wide
Here is a simple dyadic dataset in long format:
Use pivot_wider() to reshape dyad_long into wide format where each row is one dyad and columns are satisfaction_A and satisfaction_B:
Exercise: Wide to Long
Here is a dyadic dataset in wide format (one row per dyad):
Use pivot_longer() to reshape dyad_wide into long format where each row is one partner:
When do you need each format?
- Long format → multilevel models (
lmer), mostggplot2visualizations - Wide format → SEM / APIM in Mplus, computing dyad-level correlations
Type of models
- Multilevel model
- Structural Equation Model
- Actor Partner Interdependence Model
Why Does Independence Matter?
Quick Poll
Imagine you run a regular regression (lm()) predicting relationship satisfaction from communication quality, using data from 50 couples (100 individuals). What could go wrong?
- Inflated N: You treat 100 observations as independent, but you really have 50 dyads
- Underestimated standard errors: Within-couple similarity means less unique information per observation
- False positives: Confidence intervals are too narrow, p-values are too small
- Biased inference: You might conclude a predictor is significant when it is not
Multilevel model
The Study
Research scenario
Sample: 10 cohabiting heterosexual couples (20 individuals)
Research question: Is household contribution associated with expectations about the relationship’s future?
Outcome: Likelihood of marriage within 5 years (%)
Predictor: Household contribution (composite of financial contribution + household labor, mean-centered)
Moderator: Cultural background
Why is this dyadic?
Each couple shares a household, finances, and a relationship. One partner’s contribution may affect both partners’ expectations about the future.
Variable Codebook
| Variable | Description | Coding |
|---|---|---|
Dyad |
Couple identifier | 1–10 |
Person |
Individual within the dyad | 1 = Person A, 2 = Person B |
Future |
Perceived likelihood of marriage within 5 years | 0–100% |
Gender |
Gender of the individual | -1 = Women, 1 = Men |
Contribution |
Household contribution (mean-centered) | Negative = below average |
Culture |
Cultural background of the couple | 1 = American, -1 = Asian |
Note on coding
All categorical predictors use effect coding (-1, 1) so that intercepts represent the grand mean and interactions are readily interpretable.
The Data
A First Look at the Data
Within each couple
| Dyad | Person | Future | Contribution |
|---|---|---|---|
| 1 | 1 (W) | 75 | -10 |
| 1 | 2 (M) | 90 | -5 |
| 2 | 1 (W) | 55 | 0 |
| 2 | 2 (M) | 75 | 10 |
| 3 | 1 (W) | 45 | -10 |
| 3 | 2 (M) | 33 | -15 |
Notice the patterns
- Partners within a dyad tend to have similar Future scores
- Couple 1: both optimistic (75, 90)
- Couple 3: both pessimistic (45, 33)
- But there is variability within couples too
- This similarity is the non-independence we need to model
Research Questions
We can progressively build complexity:
- Descriptive: What is the average expected likelihood of marriage across all individuals?
- Main effect: Is higher household contribution associated with more optimism about the future?
- Group differences: Do American and Asian couples differ in their expectations?
- Interaction: Does the association between contribution and future expectations depend on cultural background?
Step 1: The “Wrong” Model. OLS Regression
Why is this wrong?
Standard lm() treats all 20 observations as independent, ignoring the dyadic structure.
Step 2: The Multilevel Model
We add a random intercept for Dyad to account for non-independence within couples:
Step 3: Compare OLS vs. Multilevel
Is the random effect (the dyadic clustering) significant?
What to look for
A significant p-value means the dyadic clustering matters — the random intercept improves model fit beyond the OLS model.
Interclass Correlation
How many random effects are in this model?
Two random factors:
- The dyadic covariance (the variance of the intercept)
- The error variance
Step 4: Compute the ICC
First, fit an empty model (no predictors) to isolate the dyadic variance:
Now compute the ICC manually:
Visualizing the Model
What Does the Plot Tell Us?
Fixed effects
- The slope shows the association between contribution and future expectations
- Separate panels show whether this association differs by culture (the interaction)
Random effects
- Each line segment connects the two members of a dyad
- Lines at different heights reflect different dyad intercepts
- The spread of intercepts is the between-dyad variance we captured with
(1 | Dyad)
Try it yourself
Go back to the plot code and change facet_wrap(~Culture_label) to facet_wrap(~factor(Dyad)) to see each couple separately.
Actor-Partner Interdependence Model (APIM)
Actor-Partner Interdependence Model (APIM)

Actor Partner Interdependece Model
Actor-Partner Interdependence Model (APIM)
- Pairwise data set
- Distinguishable and indistinguishable
- The trick for indistinguishable dyads is to constraint the parameters to be equal. It results in one actor effect and one partner effect.
- The null model for dyadic analysis is not the all-free model. The null model should have constrained the means and variances of the actors.
Activity: Design Your Own APIM
Answer the following for a dyadic relationship of your choice:
Who is the dyad? (e.g., parent-child, romantic partners, coach-athlete) Distinguishable or indistinguishable? Why? What is X (the predictor)? (e.g., stress, communication style) What is Y (the outcome)? (e.g., well-being, performance) What would a significant actor effect mean in plain language? What would a significant partner effect mean? Which effect do you hypothesize to be larger? Why?
Structural Equation Model Approach
Dyadic CFA

Confirmatory Factor Analysis
The Idea Behind Dyadic CFA
Why a dyadic CFA?
Both members of the dyad answer the same items. Because they share a context (the same family), the residuals of matching items are expected to be correlated.
A dyadic CFA accounts for this by:
- Defining a separate latent factor for each dyad member
- Allowing the two factors to correlate (shared perception)
- Allowing correlated residuals between matching items across members
Our example
Dyad: Parent and adolescent child
Construct: Perceived harm of alcohol use in young people
Items (same 4 for both):
- Alcohol harms physical health
- Alcohol harms academic performance
- Alcohol leads to risky behavior
- Alcohol damages relationships
Simulating Dyadic CFA Data
We simulate 200 parent-child dyads answering 4 items each:
Exporting for Mplus
Mplus expects a space-delimited .dat file with no headers:
To save the file on your computer, run this in R (not webR):
The Mplus Script: Dyadic CFA
File: dyadic_cfa.inp
Download this file from the course website and run it in Mplus.
TITLE: Dyadic CFA - Perceived Harm of Alcohol
  Parent-Child Dyads (200 families)

DATA: FILE = "dyadic_cfa.dat";

VARIABLE:
  NAMES = C1 C2 C3 C4 P1 P2 P3 P4;
  USEVARIABLES = C1 C2 C3 C4 P1 P2 P3 P4;

MODEL:
  ! Latent factors
  CHILD  BY C1* C2 C3 C4;
  PARENT BY P1* P2 P3 P4;

  ! Fix factor variances for identification
  CHILD@1;
  PARENT@1;

  ! Factor correlation (dyadic association)
  CHILD WITH PARENT;

  ! Correlated residuals across matching items
  C1 WITH P1;
  C2 WITH P2;
  C3 WITH P3;
  C4 WITH P4;

OUTPUT: STDYX MODINDICES CINTERVAL;
Reading the Output
What to look for
- Factor loadings: Do the 4 items load well on each factor?
- CHILD WITH PARENT: How strongly correlated are parent and child perceptions of alcohol harm?
- Correlated residuals (C1 WITH P1, etc.): Is there item-specific agreement beyond the latent factors?
- Model fit: Check CFI, TLI, RMSEA, SRMR
Questions for class
- What is the correlation between the child and parent factors? Is it significant?
- Which item has the highest loading for each factor?
- Are the correlated residuals significant? What would it mean if they were not?
- Try it: Remove the
C1 WITH P1;lines and re-run. How does model fit change?
Testing Measurement Invariance
To test whether the items function the same way for parents and children, constrain the loadings to be equal:
Compare models
Run the free and constrained models. A non-significant chi-square difference means the items work equivalently for both parents and children — supporting measurement invariance.
Additional Resources

EPH 752 Advanced Research Methods